September 2, 2021
Guest post by Jennifer Winter, Brett Dolter and G. Kent Fellows
Federal legislation introduced in 2018 requires a minimum carbon price on combustion emissions in all provinces and territories in Canada. This price is set at $40/tonne in 2021, will increase to $50/tonne by 2022, and will then increase by $15 per year to reach $170/tonne by 2030.
Several provinces have voluntarily implemented carbon pricing, while others have had a federal “backstop” imposed. As indicated on the map below, Alberta, Saskatchewan, Manitoba and Ontario are currently subject to the federal backstop. (New Brunswick also resisted implementing carbon pricing, but reversed its position after the 2019 federal election and has since implemented a system satisfying the federal minimum standard.)
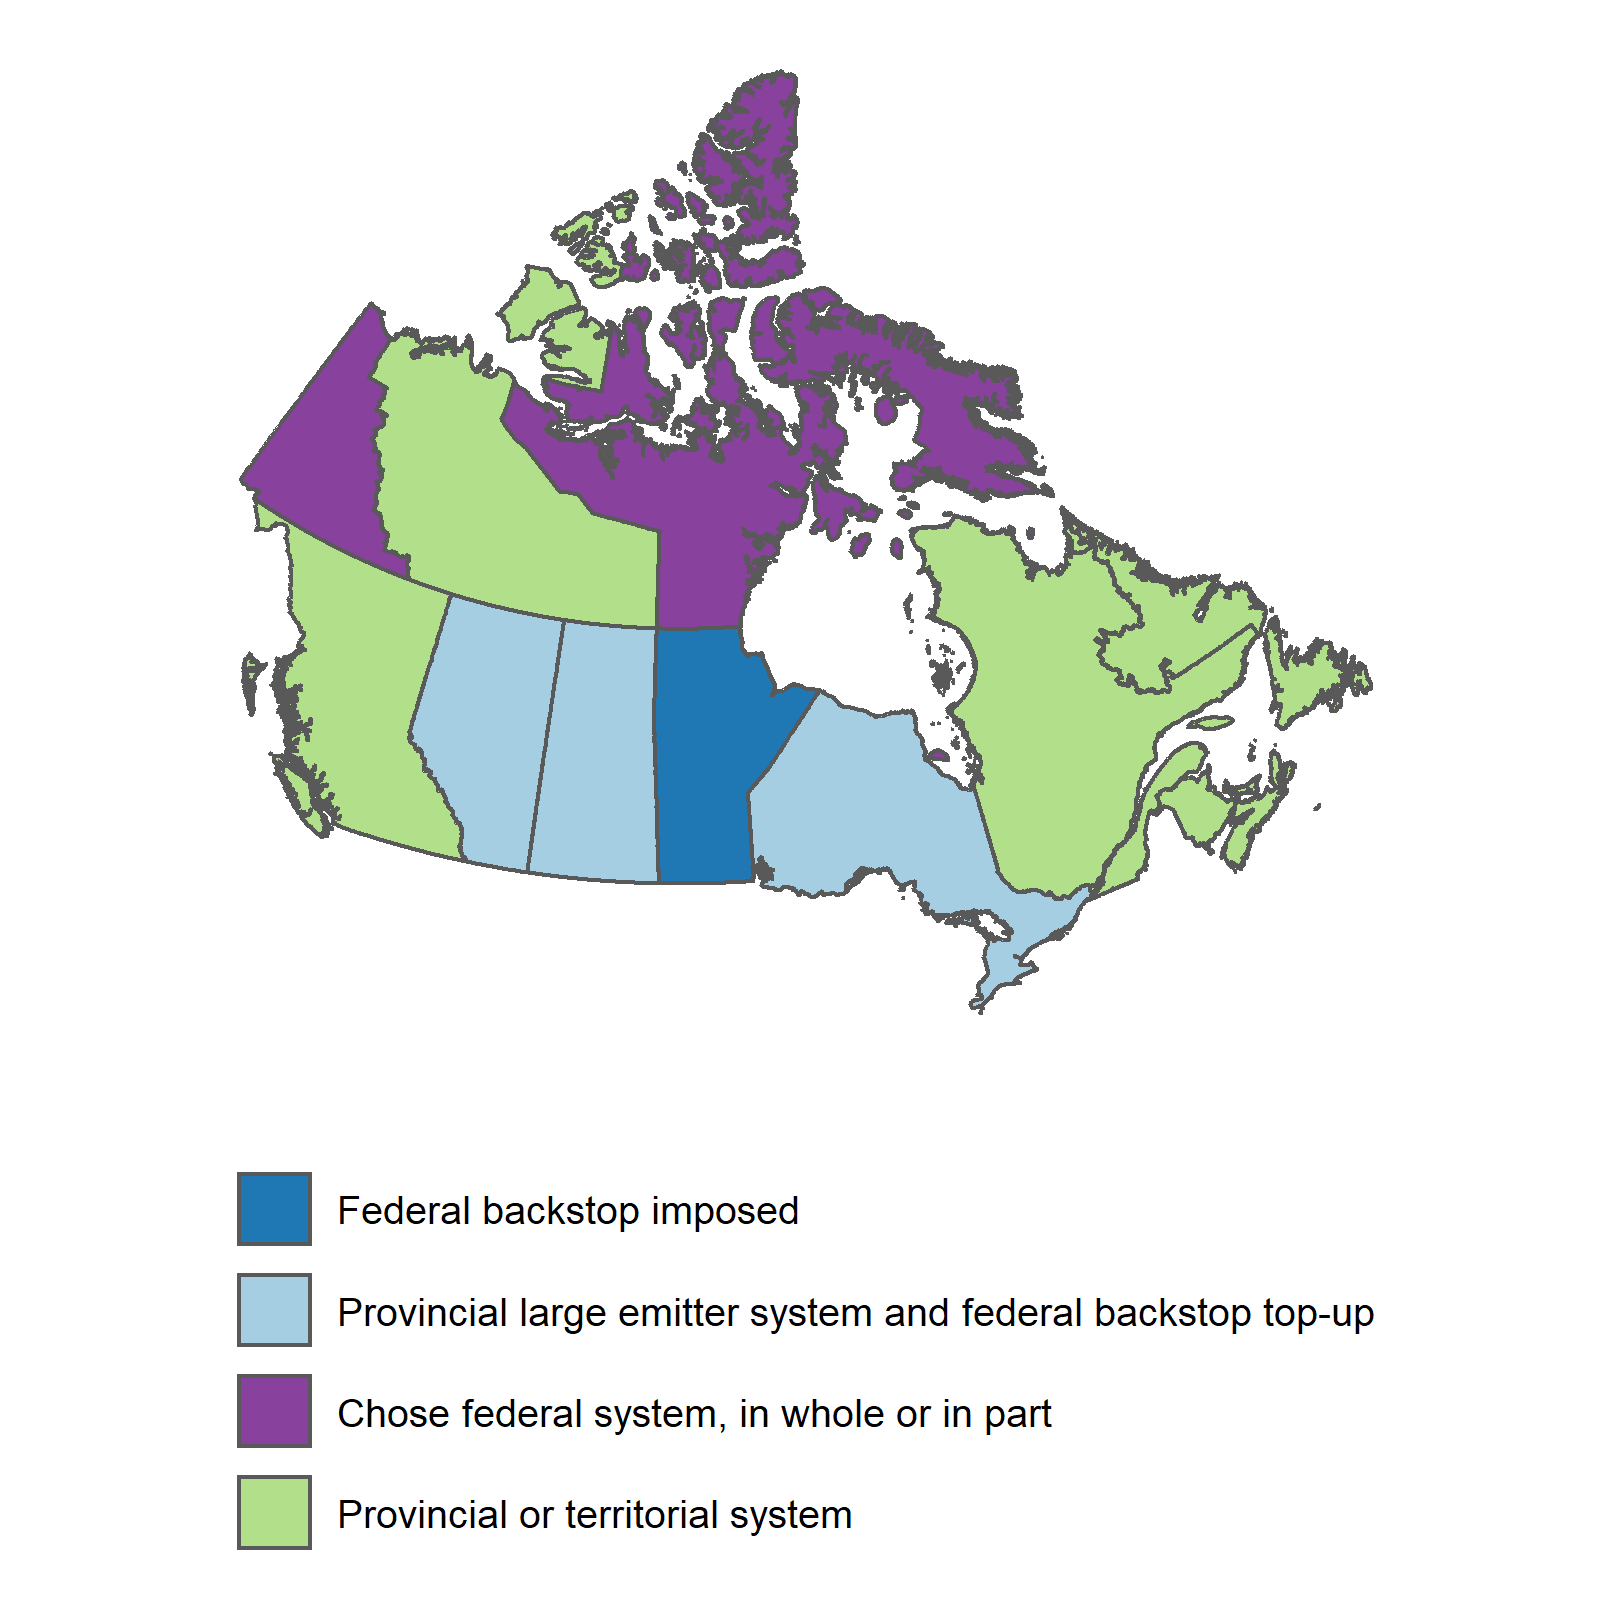
Figure 1 – Carbon Pricing Policies in Canada
Despite court challenges by the governments of Alberta, Saskatchewan, and Ontario, the Supreme Court of Canada has upheld the constitutionality of federal carbon pricing legislation. These holdout provinces must now decide whether they would like to remain subject to the federal backstop, or design their own policies to meet the federal minimum standard.
Carbon pricing generates millions of dollars in revenue which can be used to offset the associated cost burden on households. In backstop provinces, the federal program uses 90% of the available carbon pricing revenues to pay a lump sum “Climate Action Incentive” to households. The rebates are currently provided as refundable tax credits when individuals in backstop provinces file their income taxes. In 2022, the federal government will switch the payments to quarterly rebate cheques. Provincial plans can recycle this revenue using other instruments.
In our recent Smart Prosperity Institute working paper, we explore the household costs of carbon pricing across income distribution. We estimate direct costs such as the carbon tax on gasoline and natural gas, and indirect carbon pricing costs passed from businesses to households. We then estimate the net cost of carbon pricing to households under four revenue-recycling approaches:
We want to know how households, in particular low-income households, fare under each revenue recycling option. In our analysis, we assume households do not change their consumption behaviour towards lower emissions purchases to reduce the burden of carbon pricing. In that sense, our results are a worst-case scenario for the cost of carbon pricing. (For details on the methodology, please see our working paper.)
When evaluated relative to household spending, we find that a carbon price is generally progressive even without revenue recycling. This means that for lower income households, carbon pricing represents a smaller proportion of total spending when compared to high income households.
However, evaluated relative to household income, we find that carbon pricing appears regressive without revenue recycling. For lower income households it represents a relatively larger proportional drain on income when compared to high income households.
Revenue recycling changes the progressivity of carbon pricing. Our results show that using carbon pricing revenue to increase a means-tested GST/HST credit or to provide a lump sum rebate makes carbon pricing more progressive. These policies also succeed in making the majority of low-income households better off than they would have been without carbon pricing. This means the financial gain from the revenue recycling policy is of greater value than households’ expected carbon pricing costs.
Conversely, we find that a sales tax rate reduction is mostly regressive, and an income tax reduction is clearly regressive. This means that low-income households end up worse off after carbon pricing if the revenue is used to cut the sales tax or decrease income taxes. Many higher income households end up better off.
We summarize the distributional impacts of carbon pricing using box-and-whisker plots. In these plots, households in each province are categorized by the net return they receive. Net return is equal to the financial benefit of the revenue recycling policy (e.g. the tax credit or lump-sum rebate received, or the savings from a sales tax or income tax reduction) minus the carbon pricing cost. Households with a positive net return receive more back from the revenue recycling policy than they pay in carbon pricing costs.
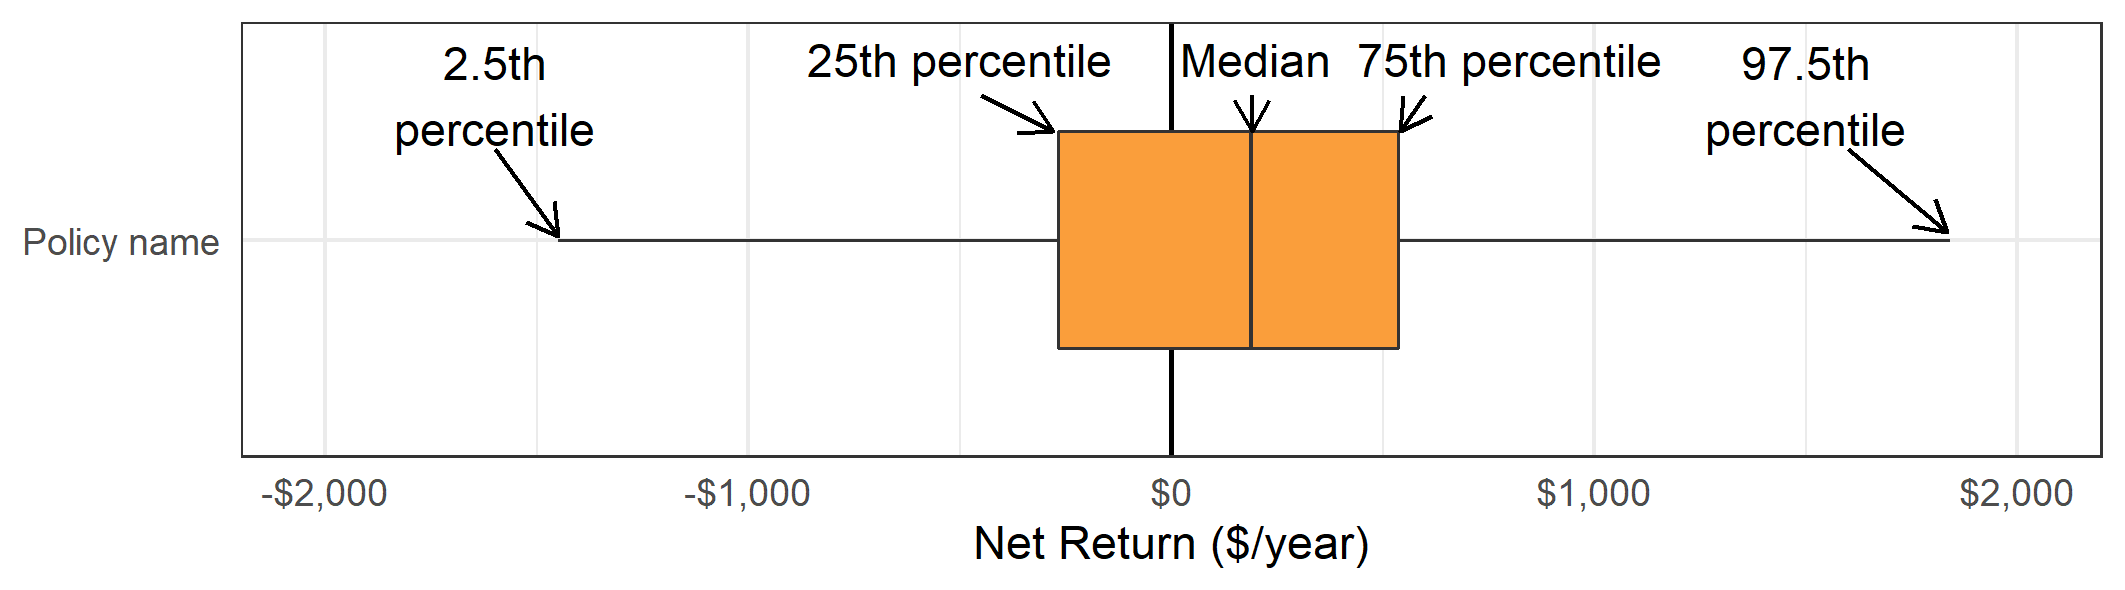
Figure 2 – Interpreting a Box-and-Whiskers Plot
Figure 2 illustrates the components of a box-and-whiskers plot. The dark line within each box indicates the net return for the median household (50th percentile). Half of households receive a net return higher than the median household, and half receive a net return lower than the median household. The edges of the box are set at the 25th percentile of net return on the left and 75th percentile of net return on the right. This means that half of households receive a net return within the range of the box. The whiskers show the distribution of outliers. In our figures, we set the length of the whiskers to extend to the 2.5th percentile of net return on the left-hand side, and 97.5th percentile of net return on the right-hand side. This means only 2.5% of households receive a net return lower than the left-hand side whisker, and only 2.5% of households receive a net return higher than the right-hand side whisker.
Figure 3 below presents box-and-whiskers plots for every revenue recycling policy and province. (The working paper includes more detailed distribution results.) To show how carbon pricing and revenue recycling impacts households of different income levels we divide each province into five, equal-sized income groups or quintiles. For each province and policy scenario we show five box-and-whisker plots, which represent the five income groups. The colour of each boxplot differentiates the income groups.
For a quick interpretation of the results, you can look at the position of the median line and boxes in the box-and-whisker plots. When the median line inside the box is to the right of the $0 net return line, at least half of households see a net financial gain under that particular revenue recycling policy. When the whole box is to the right of the $0 net return line that means at least 75% of households within that income quintile will see a net financial gain. The lowest income quintiles in each province have boxes that are typically to the right of the $0 return line in the case of the means-tested tax credit and the lump-sum dividend. This means the majority of low-income households are better off after carbon pricing is introduced when these progressive revenue-recycling methods are applied.
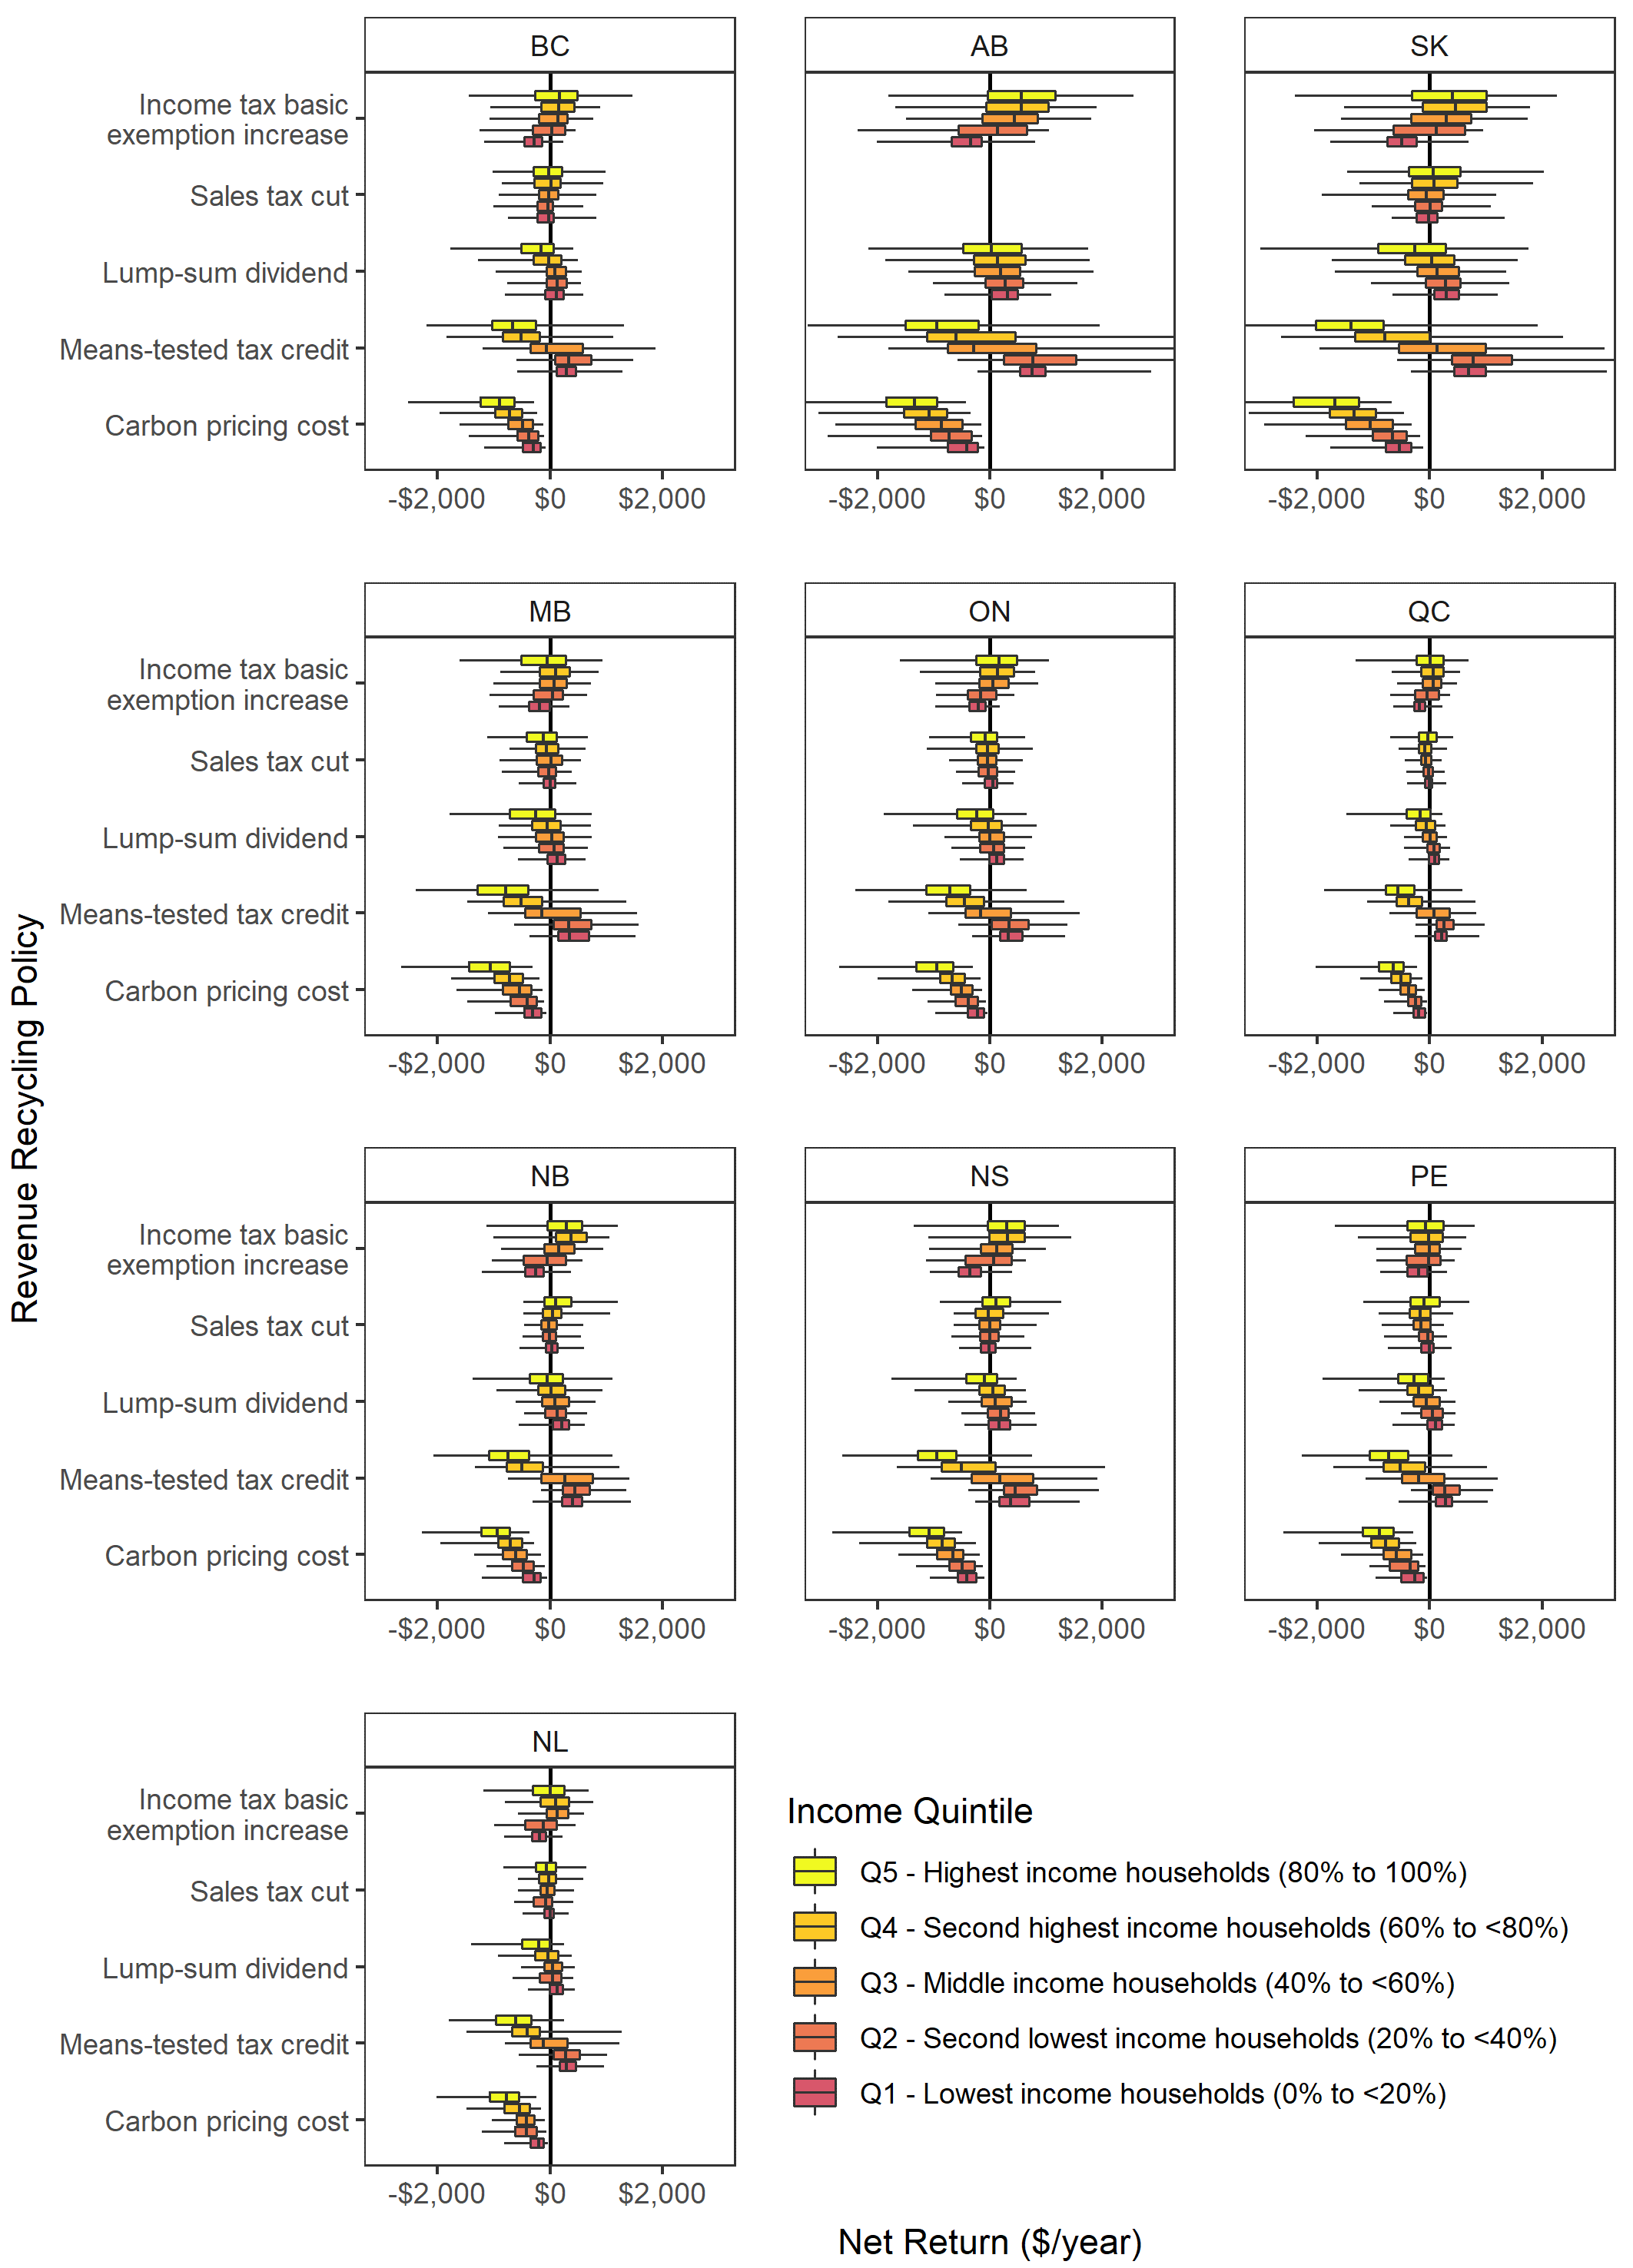
Figure 3 – Net Return (Rebate less Costs) from Carbon Pricing and Different Revenue-Recycling Options, at $50 CAD per tonne (2020 dollars)
If a box is entirely to the left of the $0 net return line that means at least 75% of households in that income quintile are worse off under the policy and register a net financial cost. All box-and-whisker plots are to the left of the $0 net return line for the “carbon pricing cost” policy because this represents the cost of carbon pricing without any revenue recycling. For the income tax changes, you can see that the lowest income quintile (Q1) box is typically to the left of the $0 net return line. This indicates that an income tax cut is a regressive way of recycling carbon pricing revenues, and leaves the majority of low income households worse off.
We can zoom in on the four backstop provinces to take a closer look at their options for revenue recycling (Figure 4). A clear picture emerges. If Alberta, Saskatchewan, Manitoba and Ontario want to ensure that carbon pricing does not reduce the incomes of low-income households, this requires a means-tested tax credit, or lump-sum rebate. Of these two options, the lump-sum dividend introduced by the federal government provides more relief for middle and higher income households and so, from a political acceptability perspective, may be more desirable. If provinces choose to use carbon pricing revenues to reduce income taxes, they may want to combine this with means-tested rebates to help low-income households.
Carbon pricing has been criticized for harming low-income households who may not have the financial means to make their homes more energy efficient, or buy an electric vehicle. Our analysis shows that revenue recycling can be used to lower the burden of carbon pricing on low-income households. In fact, progressive policies like the means-tested rebate and lump-sum dividends can leave the majority of low-income households better off than they would have been without the carbon pricing policy, leading to both climate and equity wins.
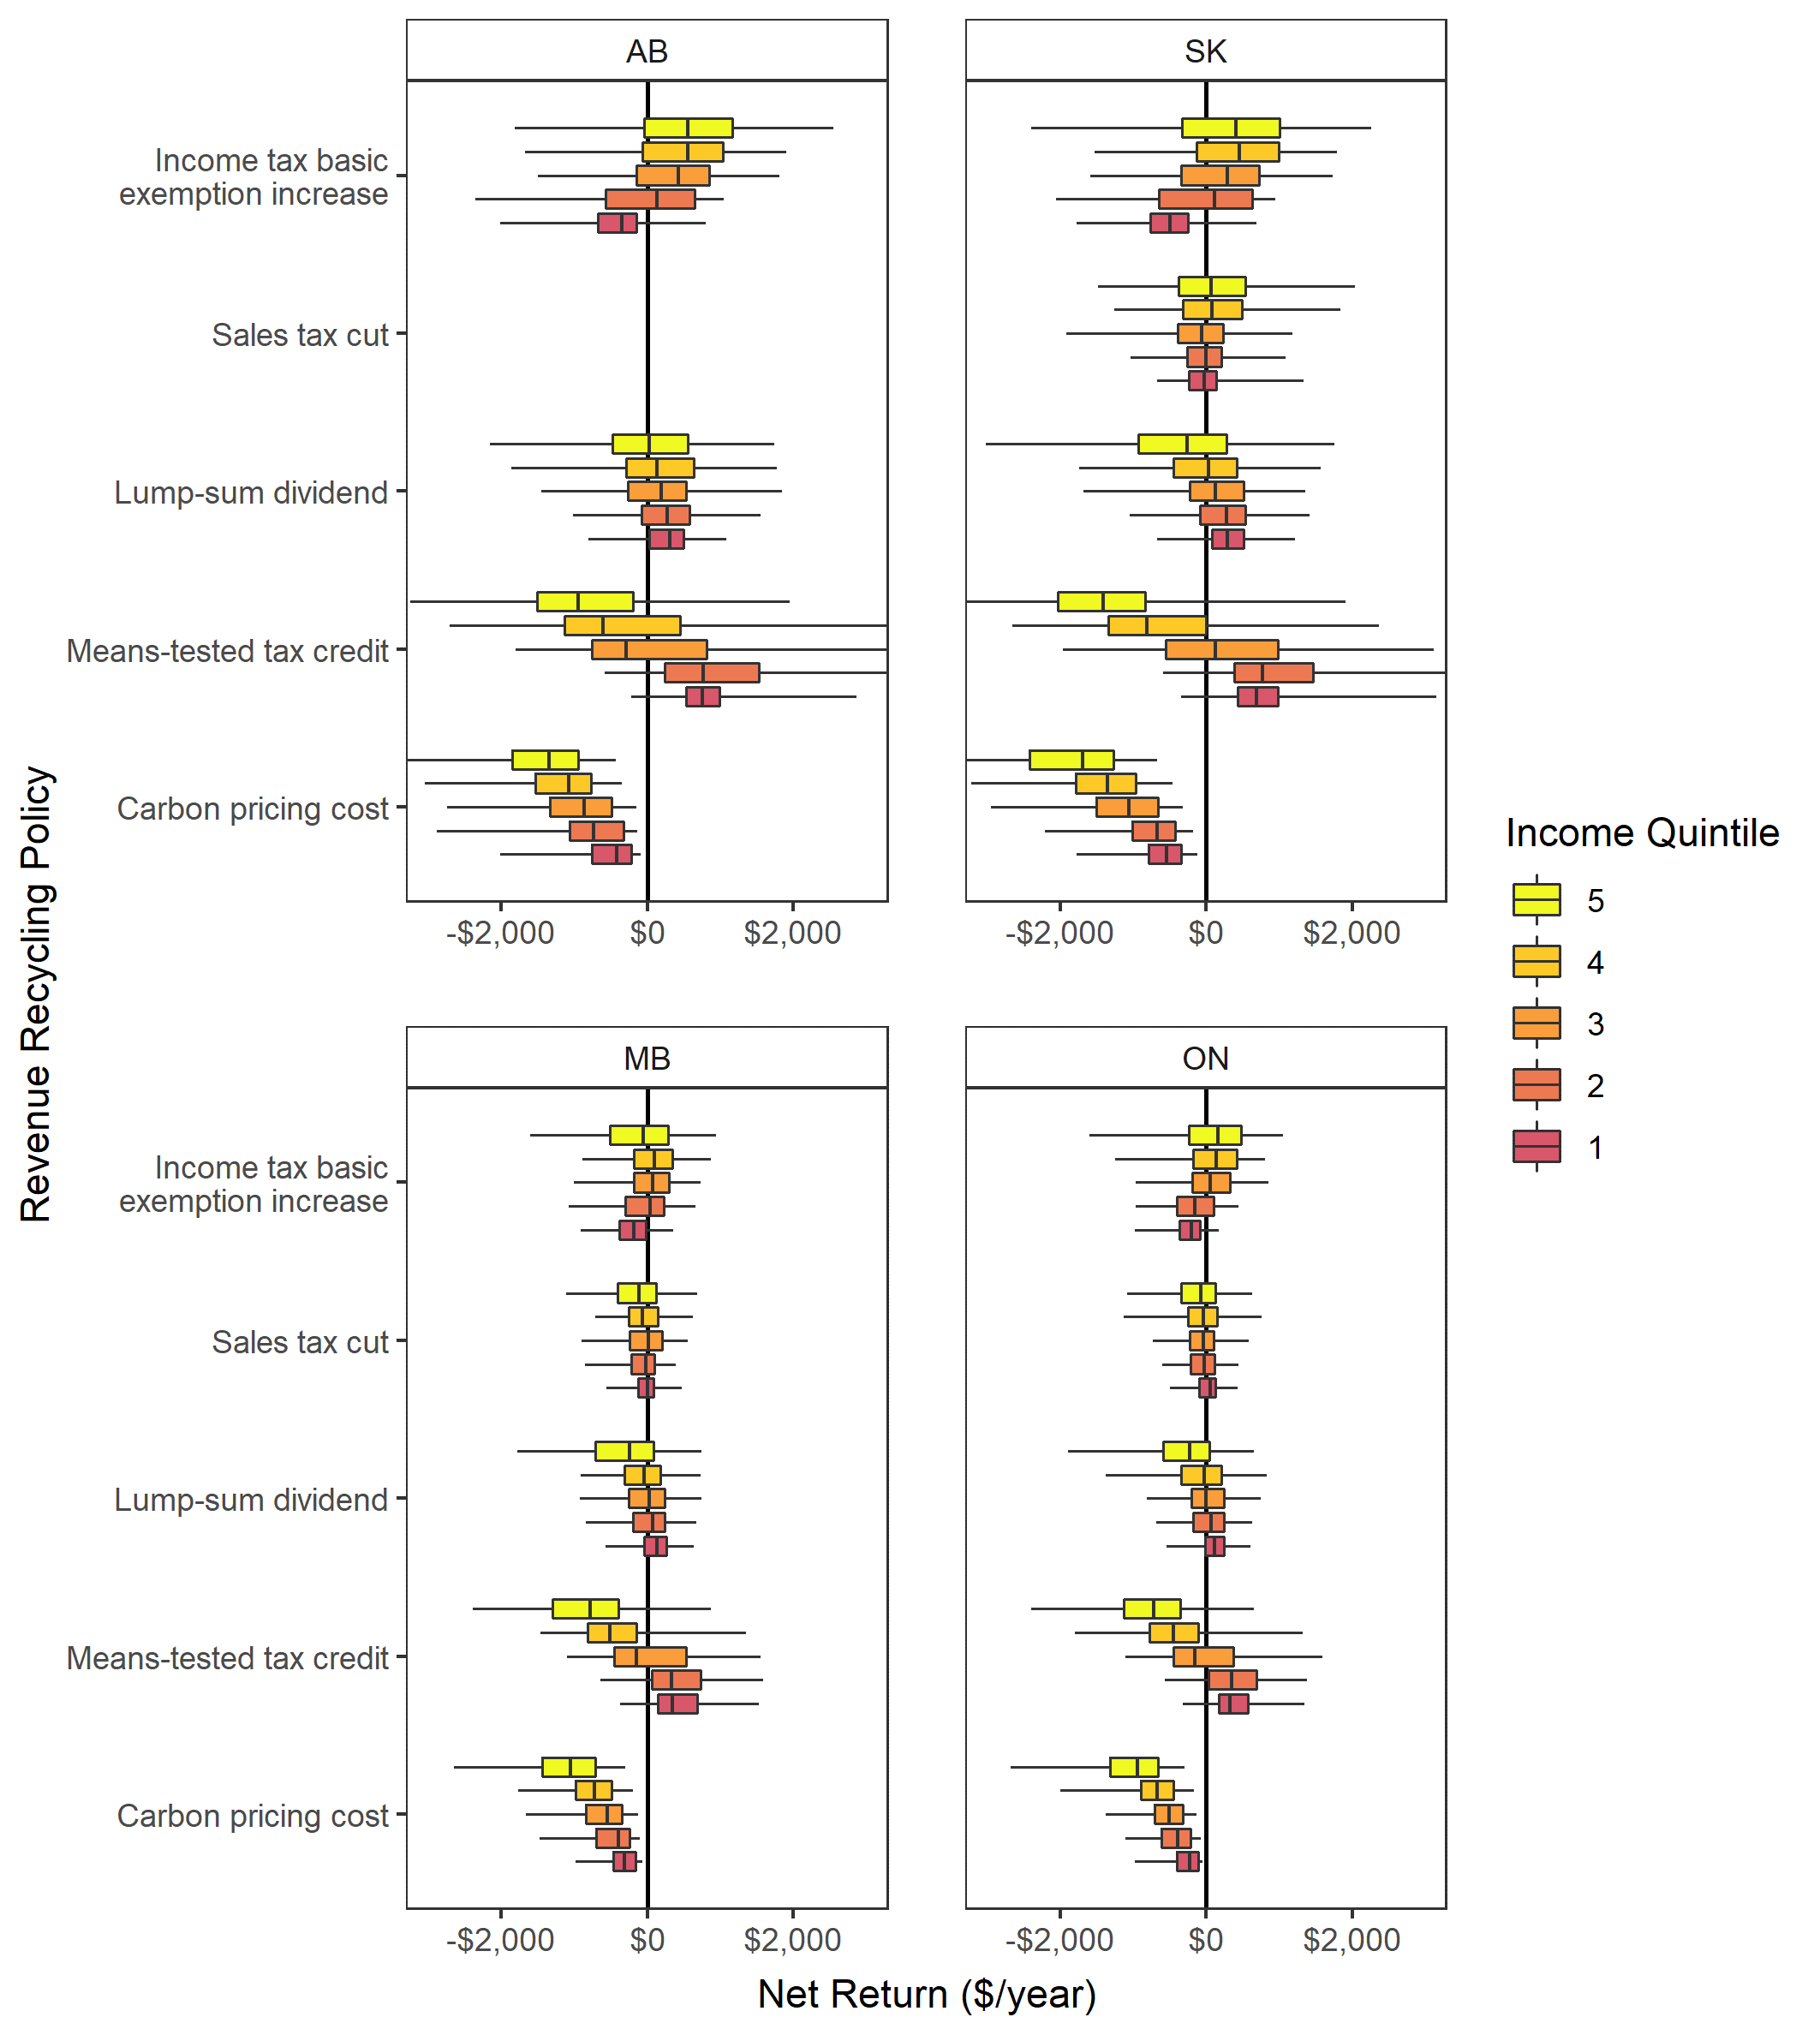
Figure 4 – Net Return (Rebate less Costs) from Carbon Pricing and Different Revenue-Recycling Options for the Backstop Provinces, at $50 CAD per tonne (2020 dollars)
To learn more, check out the full Smart Prosperity Institute working paper on Carbon Pricing Costs for Households and the Progressivity of Revenue Recycling Options in Canada. Also stay tuned for the next installment in this blog series where the authors take a closer look at the results of the study for New Brunswick and the implications of the province’s choice to increase the personal income tax basic exemption.

Assistant Professor in the Department of Economics at the University of Regina

Associate Professor at The School of Public Policy, University of Calgary

Associate Professor of the Energy and Environmental Policy research division at The School of Public Policy, University of Calgary
©2026 Smart Prosperity Institute. All rights reserved.
Contact us:
info@smartprosperity.ca | 1 Stewart St (3rd Floor), Ottawa, ON, K1N 6N5