
November 29, 2018
By: Katherine Monahan and Scott McFatridge
In 2008, British Columbia implemented North America’s first broad-based carbon tax, which has since attracted significant international and domestic attention. The carbon tax was introduced at $10/tonne of carbon dioxide equivalent in 2008, and reached $30/tonne in 2012i. Beginning April 1, 2018, the rate increased to $35/tonne and is slated to increase each year by $5 per tonne until it reaches $50 per tonne in 2021. For comparison, the federal benchmark carbon price reaches $50 per tonne in 2022.
Until the 2017/2018 provincial budget update, the carbon price was almost entirely revenue neutral, with proceeds recycled through reductions in personal and corporate income taxes, along with tax credits for low-income households and select industriesii.
Thus far the BC carbon tax appears to be fulfilling its purpose. Today’s most recent data (2016) indicates that British Columbia’s overall greenhouse gas (GHG) emissions are 60.1Mt, over 5% lower than they were in 2005 (63.3Mt)iii. Meanwhile, between 2007 and 2015, provincial real GDP grew more than 17%. In fact, according to Statistics Canada, British Columbia's economy has expanded by more than 3% in each of the last four years. Real GDP growth in the province accelerated to 3.9% in 2017, the fastest pace of growth in the province since 2005, the second fastest growth of any province, and significantly faster than the Canadian average of 3.3%iv.
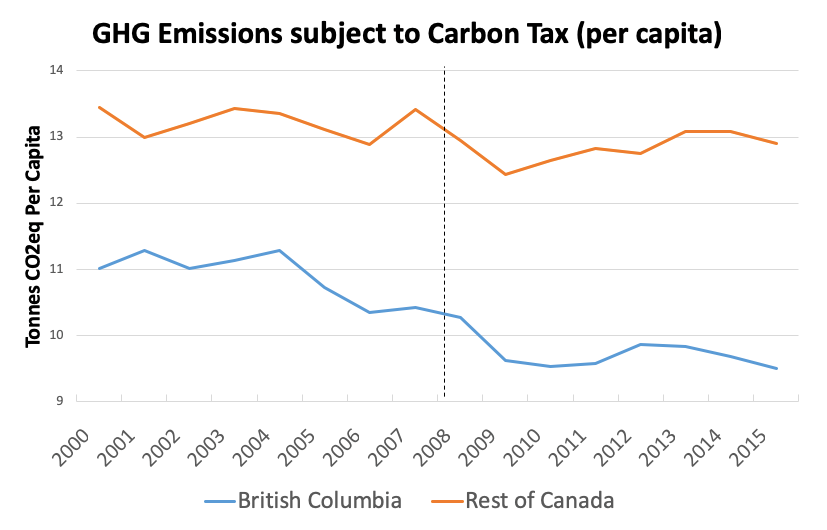
The graph below depicts per capita GHG emissions from energy combustion in both BC and the rest of Canada. Combustion based emissions are used since BC’s carbon tax only applies to the purchase and use of fossil fuels - covering approximately 70% of provincial GHG emissions. In other words, these results focus on the parts of the BC economy covered by the carbon tax. The graph indicates that BC’s ‘carbon taxed’ per capita emissions decreased by 7.6% between 2008 and 2015 compared to a 0.4% decline in the rest of Canada. Meanwhile, real GDP per capita increased by 6.4% compared to only 3.1% in the rest of Canadav.
Subsector analysis can also help paint the picture of success. For example, total transportation GHG emissions in British Columbia have remained relatively stable since 2005 (2005 = 24.6Mt compared to 2016 = 24.9Mt) whereas they have increased by 4% in the rest of Canada.
Although results like these appear promising, the questions often posed is: yes, but where would BC’s GHGs and economy have been in the absence of the carbon tax?
In order to help answer that question with more precision, researchers attempt to create “counter factuals”, a scenario that goes back in time to remove the carbon tax from future projections. The counter-factual must consider elements such as: BC’s rising population, shifting demographics, energy market dynamics (prices, demand and supply) and other drivers that impact GHG emissions. For example, BC had historically been transporting natural gas to Eastern Canada but the US shale gas boom led to a significant decrease between 2005 and 2011. Factors like this can influence both the economy and emissions, and must therefore be accounted for and controlled using the counter factual analysis.
Several academic analyses have attempted this statistical exercise over the years. These have largely confirmed the projected benefits of the carbon price, while also highlighting some policy design considerations. The carbon tax is estimated to have substantially reduced the consumption of fossil fuels in the province including: gasolinevi, diesel fuelvii and residential and commercial natural gasviii. It has also spurred the purchase of more fuel-efficient vehiclesix.
On the basis of these results, Murray and Rivers estimated that from 2008 to 2015, the carbon tax had reduced GHG emissions by 5% to 15% relative to business-as-usualx -- potentially even greater than the 5% originally projected in the early modelling commissioned by the provincexi. Other studies have failed to identify any statistically significant negative effect of the carbon tax on B.C.’s economic growth ratexii.
In general, quantitative research agrees that BC’s carbon tax has been effective, including by inducing behavioural and investment changes towards low carbon choices, such as more fuel-efficient vehicles or lower emitting heating fuels. Since 2008, when the carbon tax came in, B.C. has substantially outpaced the Canadian average in both per capita energy related emissions reductions and per capita GDP growth, confirming that a well-designed, rising carbon price is an effective tool for climate change mitigation without harming the economy.
©2026 Smart Prosperity Institute. All rights reserved.
Contact us:
info@smartprosperity.ca | 1 Stewart St (3rd Floor), Ottawa, ON, K1N 6N5